Table of Contents
Accessible through the back-end , menu item.
Akeeba Ticket System's Control Panel
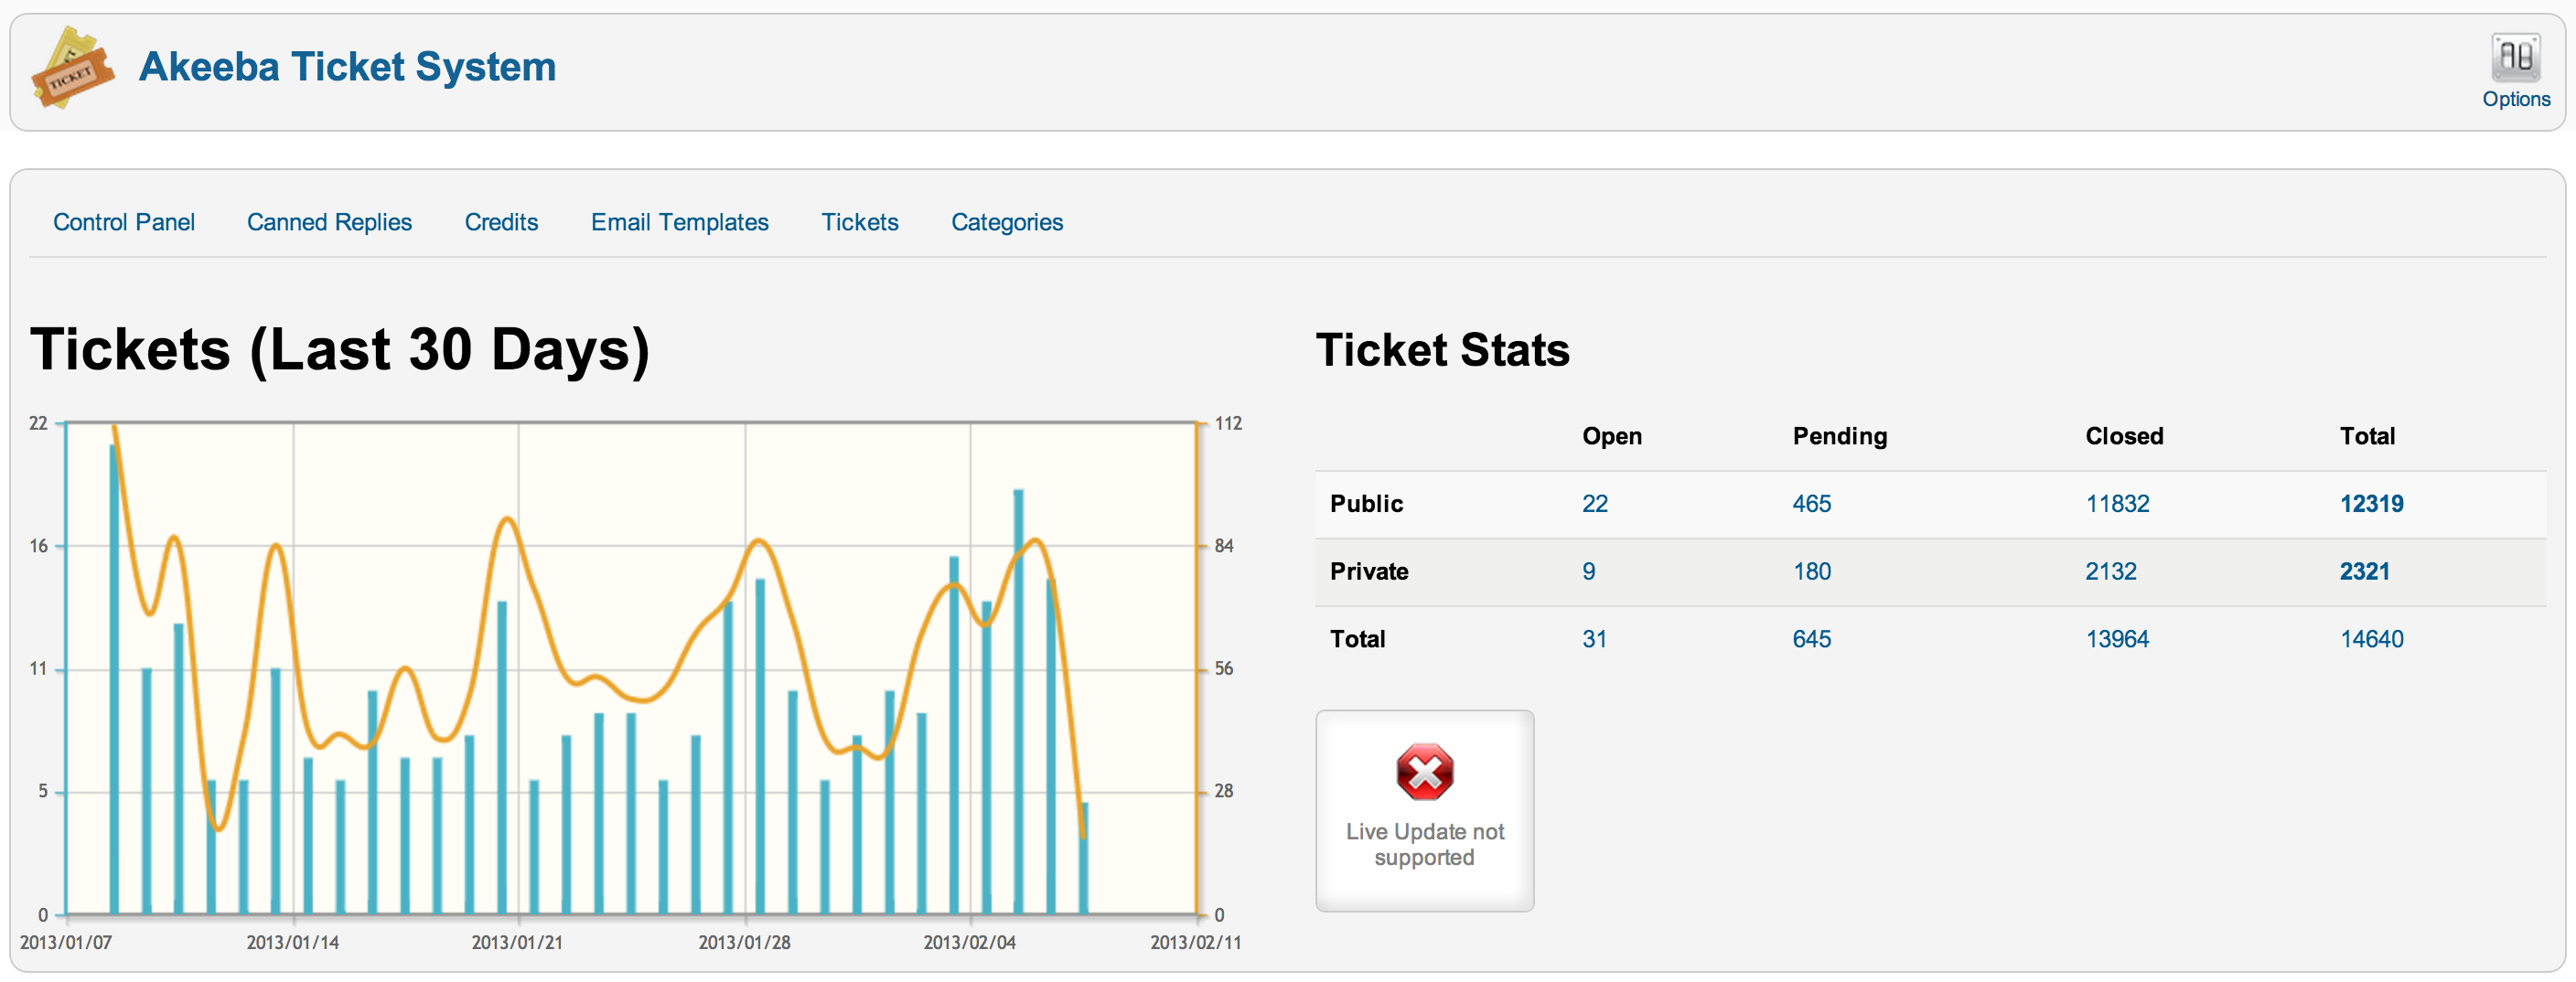
The Control Panel page is the main hub of Akeeba Ticket System's management. On this page you get some very useful information:
-
A graph of your tickets and posts for the last 30 days. The bars represent the number of new tickets per day, the orange line the number of posts per day. Hovering your mouse (or tapping, on a touch display) the graph will show you the date and number of tickets / posts at that point.
-
The support quality leaderboard, if you have enabled the user feedback feature in the Options of the component. This shows the average support quality score of each member of the support staff over the last week (7 days), month (30 days), year (365 days) and overall.
-
Your ticket statistics. This is a break-down of open, pending, closed and total public and private tickets. Clicking on a number will open the Tickets page with the respective filter applied. For example, if you click the number of Open and Public tickets the Tickets page will open with the filters set to display only open and public tickets.
You can navigate between the backend pages of the component by using the links at the top of the page, right below the component's title. You can access the component options by clicking on the button in the toolbar.