Table of Contents
- 1. The Control Panel
- 2. The component Options
- 3. Fixing the permissions of files and directories
- 4. Emergency Off-Line Mode
- 5. Protect your administrator back-end with a password
- 6. The .htaccess maker
- 7. The NginX configuration maker
- 8. The web.config maker
- 9. Web Application Firewall
- 9.1. Visitor IP addresses in Joomla
- 9.2. Configure WAF
- 9.3. WAF Exceptions
- 9.4. Third-party integration API
- 9.5. WAF Deny List
- 9.6. Administrator Exclusive Allow IP List
- 9.7. Site IP Allow List
- 9.8. Site IP Disallow List
- 9.9. Anti-spam Bad Words
- 9.10. Blocked Requests Log
- 9.11. Auto Blocked IP Addresses
- 9.12. Auto IP Blocking History
- 9.13. Email templates
- 10. Database tools
- 11. The PHP File Scanner
- 12. SEO and Link Tools
- 13. Reset Joomla! Update
- 14. URL Redirection
- 15. Cleaning your temporary files directory
- 16. Protecting Admin Tools with a password
- 17. Import and Exporting Settings
- 18. Access Control
- 19. The "System - Admin Tools" plugin
- 20. Automating maintenance tasks
- 20.1. Admin Tools – PHP File Change Scanner
- 20.2. Admin Tools – Blocked Requests Log cleanup
- 20.3. Admin Tools – Session table repair & optimise
- 20.4. Admin Tools – Clean up session metadata
- 20.5. Admin Tools – Cache clean-up
- 20.6. Admin Tools – Clean up the temporary directory
- 20.7. Admin Tools – Delete inactive users
- 20.8. Admin Tools – Auto-import configuration
- 20.9. Admin Tools – Reset Joomla! Update
- 21. Rescue Mode
- 22. Custom public folder
- 23. Troubleshooting guide
- 23.1. — THIS HEADER IS INTENTIONALLY LEFT BLANK —
- 23.2. Administrator password protection issues
- 23.3. New Super Users are blocked and deactivated after login
- 23.4. Can not create or edit Managers, Administrators, Super Administrators using Admin Tools (403 error thrown)
- 23.5. Locked out of my site after applying a .htaccess using Admin Tools' .htaccess Maker
- 23.6. Admin Tools' Web Application Firewall (WAF) locked you out of your site
- 23.7. My components, modules or templates stopped working after using Admin Tools .htaccess Maker and how to determine and apply exceptions
- 23.8. I created a .htaccess file on my main site and I can't access my other domains / subdirectories on the same account
- 23.9. The administrator secret URL parameter is not working
- 23.10. There are too many security exceptions. Should I be worried?
The main page of the component which gives you access to all of its functions is called the Control Panel.
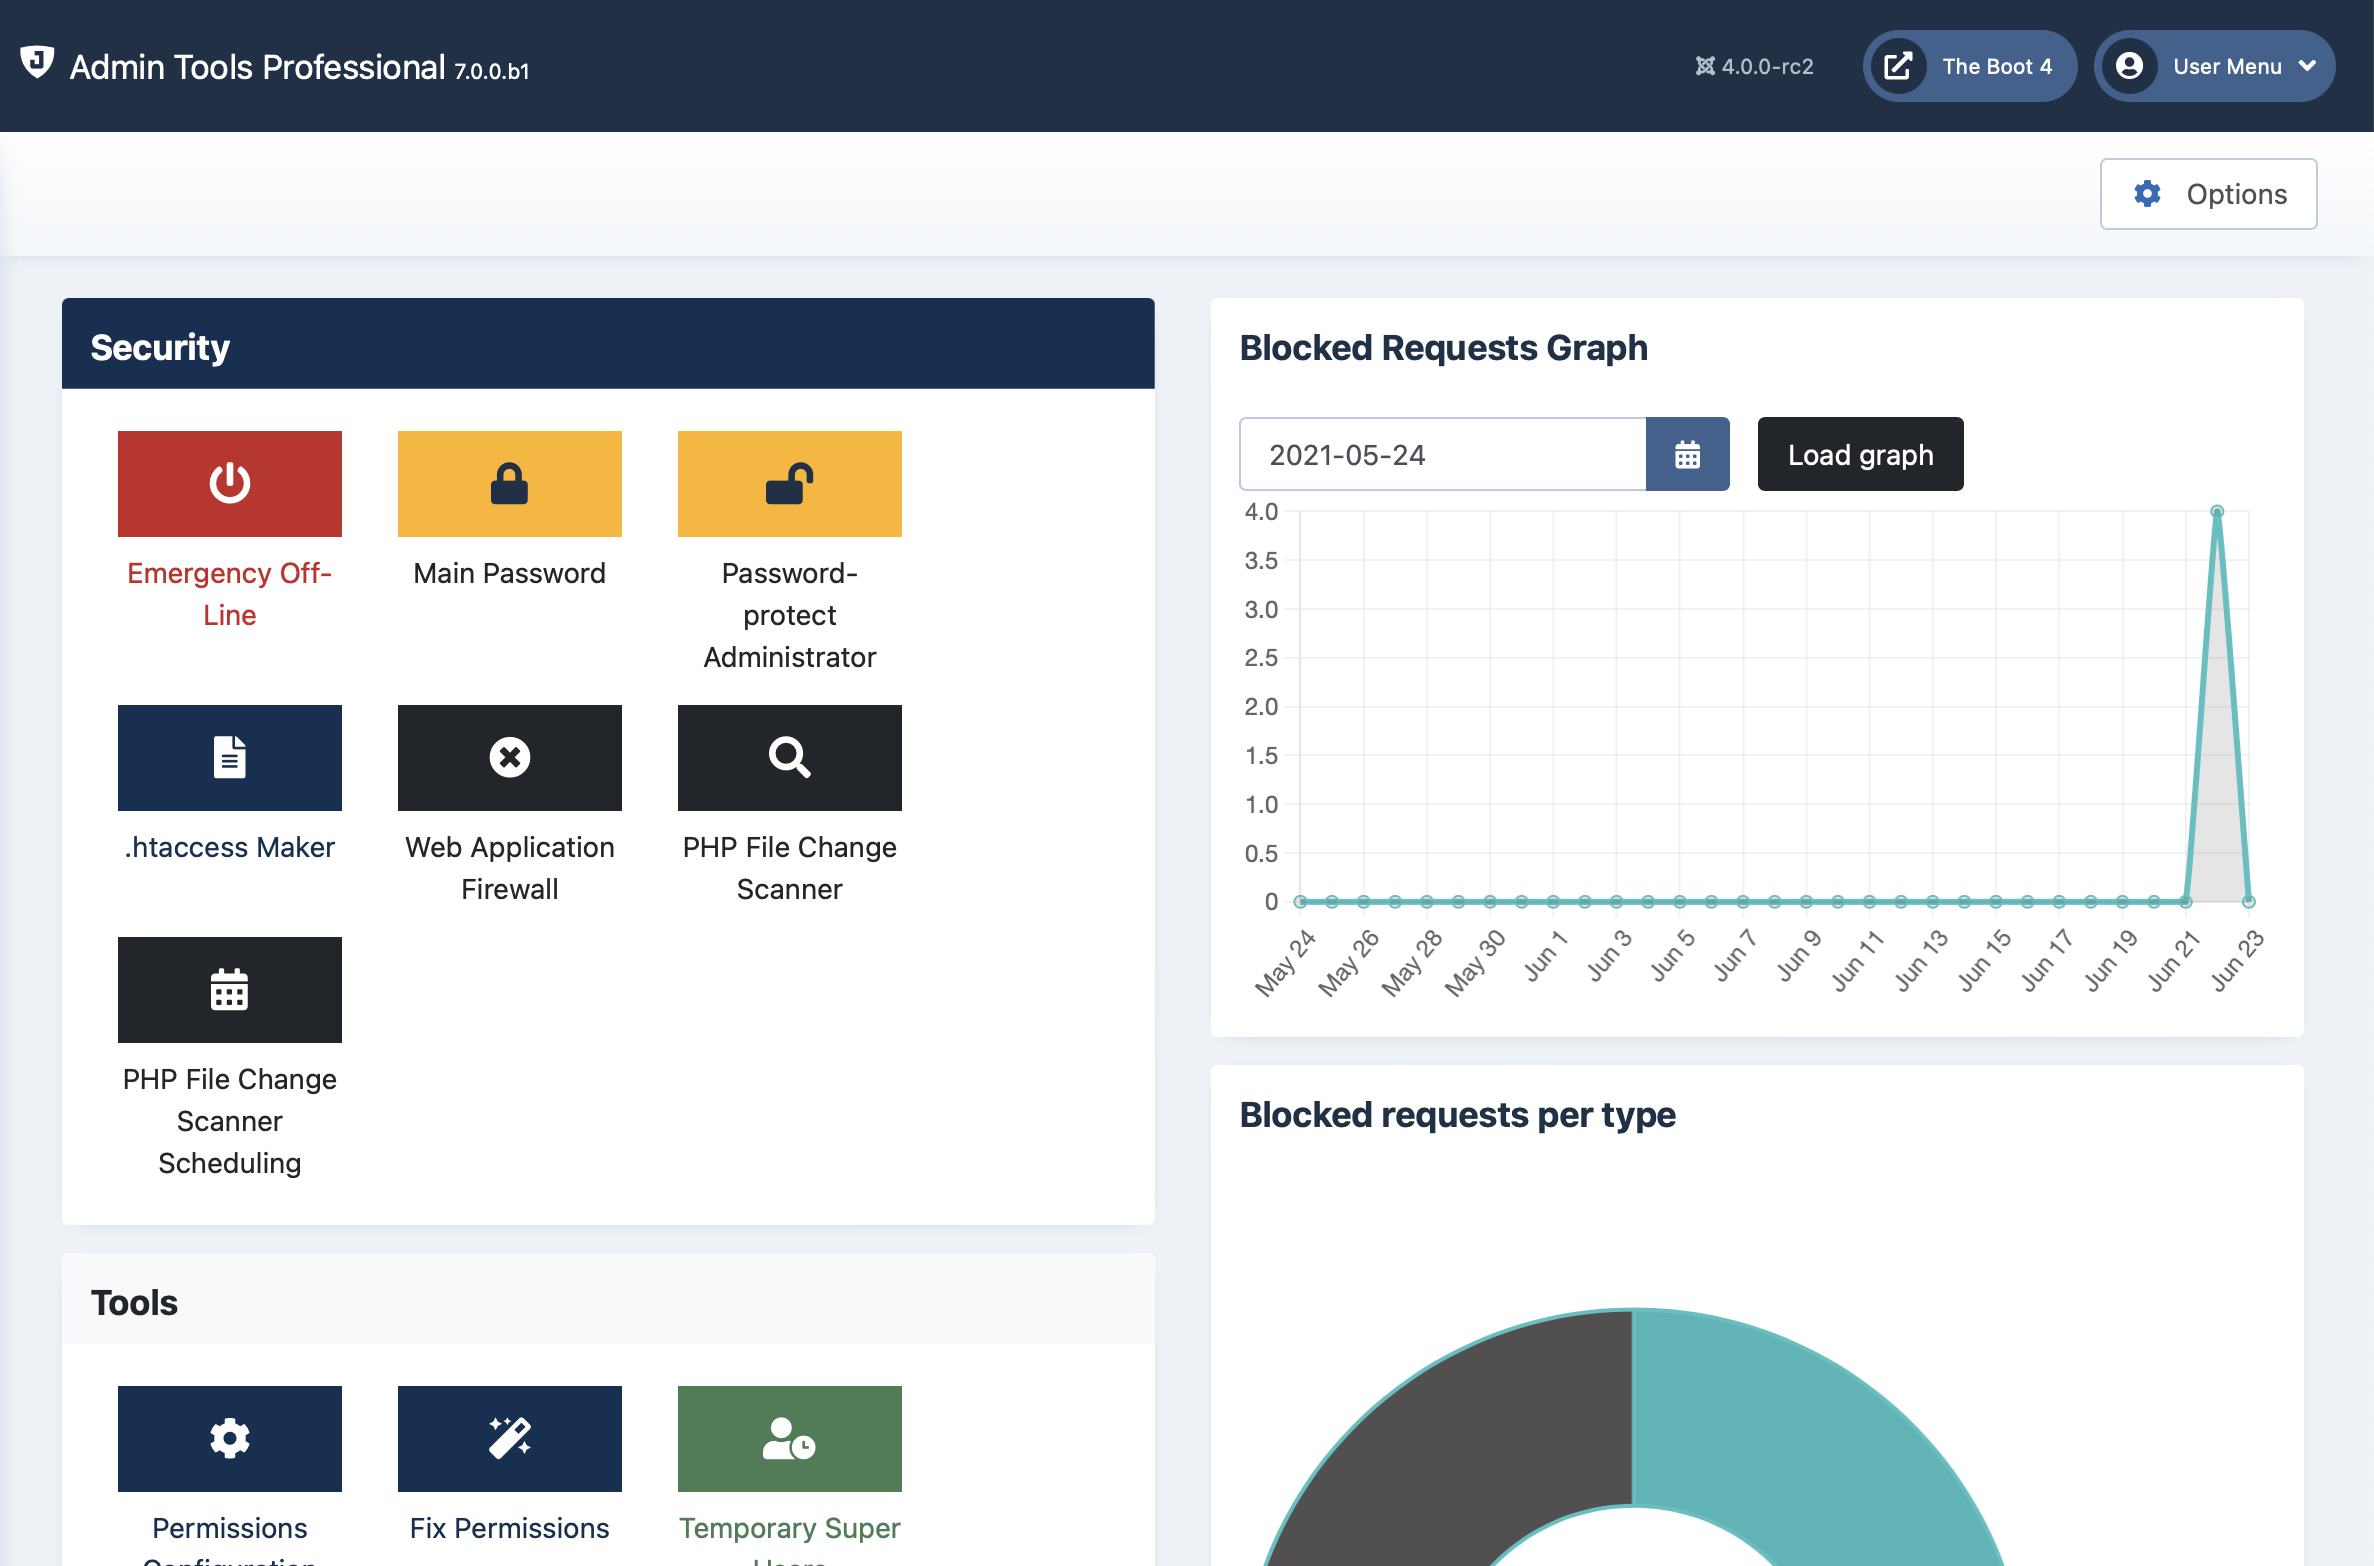 |
In the left hand area you have icons which launch the individual tools out of which Admin Tools is made when clicked. Each of those tools is described in a section of its own in the rest of this documentation. The screenshot above is for illustrative purposes only. Your version of Admin Tools may display different icons, or display them in a different order.
Clicking on the button will launch the System - Admin Tools plugin configuration page in a pop-up dialog box. In there, you can configure the scheduling options for Admin Tools' utilities. Do note that this feature is only available in the Professional edition.
The graphs on the right hand side display the number of blocked requests logged (potential attacks Admin Tools Professional has protected you against), their distributions by type and a few statistics about them, e.g. how many requests were blocked in the last year, month, week, day and so on.
Please note that the number of requests blocked IS NOT MEANT TO BE USED AS A MEASURE OF HOW WELL ADMIN TOOLS PROTECTS YOUR SITE. The number of requests blocked depends on EXTERNAL FACTORS, namely how many attacks were launched against your site in a period of time. Most sites will experience a great variance of this metric over time. It is perfectly normal and very common to see just a handful or no attacks for days or months at a time, then a short but sudden burst of hundreds to thousands of blocked requests over the span of a few hours to a few days. The idea behind the graphs is to make you aware of these spikes which indicate that a malicious showed an interest on attacking your site. The graph showing the types of attacks is a good indication of what they tried to use when probing or attacking your site. That's all there is to it. These are not Key Performance Indicators (KPIs), they are just a quick glance at the information you could extract by poring over the blocked requests log yourself.
The lower panes display the Admin Tools version information. You can see the version of the software and display the changelog. Finally, there's a reminder that security extensions are not a panacea, they are just one of the many tools in the defender's arsenal.